Reporting live from the office, it’s me, your favorite non-engineer in this internship! (by default as the only one) Unlike everyone at the design studio, I have no exciting photos of the device I’m working on. Instead I thought it was more realistic to have a picture of some of the data I’m working with. As exciting as over 200,000 data points sounds, it can be a slight pain to manage! Here’s a spreadsheet of some of the ambient temperature data collected from the nurseries at different hospitals.

Essentially, each time our CPAP team visits a district hospital to check on equipment and ensure proper maintenance on CPAP devices, they gather temperature information from sensors that run 24/7. Unfortunately, they usually end up putting these txt files into a dropbox folder and then don’t get a chance to organize them. Now that our CPAP office has a handy dandy intern (oh hi, that’s me) we now get a little more analysis and insight into how hospitals are managing their temperatures! I took aaalllllll of that information and condensed and compiled and sorted and added until we could look at all these numbers and actually understand what was going on. As a result we can now compare night vs. day temperatures, Northern vs. Central vs. Southern hospitals, summer and winter temperatures, District vs. Central hospitals, etc. The graph below managed to provide a very interesting insight on this last comparison.
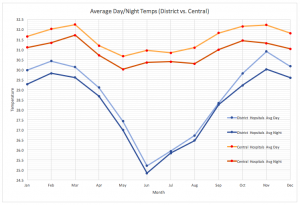
On this graph the warm colored lines demonstrate Central hospitals (yellow line is daytime, orange line is nighttime) and the blue colored lines show District hospitals (lighter line is day, darker line is night). What we can see is that the larger, better funded Central hospitals manage to keep relatively consistent temperatures throughout the year, only dipping slightly during the colder month. However, the District hospitals show a huge drop in ambient temperature in the nurseries.
You might be wondering – why do we care about the air temperature anyways? Newborn infants, especially those who are premature, often struggle to maintain body temperature. Hypothermia kills lots of neonates each year because when so much energy is spent trying to maintain temperature, their bodies have a harder time fighting infection, breathing, or absorbing nutrients. One discovery when analyzing CPAP data was that below a certain threshold temperature, it doesn’t matter if the infant is put on CPAP or not, they usually don’t make it. This knowledge energized efforts to keep neonates warm through all means possible. While kangaroo mother care (where the baby is wrapped tightly to the mother with skin to skin contact and radiant warmers/ hot cots are very useful tools, often they are not enough by themselves. All hospitals are strongly encouraged to use any available space heaters and warming lamps to keep the entire nursery at a higher temperature. This way babies are better supported while being fed, moved, or adjusted. As a result of organizing this ambient temperature data we now have more insight when looking at mortality rates month by month. It might be able to help explain differences between Central and District hospitals throughout the year. It’s great to see that the Rice 360 program and our CPAP team here in Malawi are not just focused on one device. Instead they are dedicated to determining each element of essential neonatal care so that the support and technology we provide is comprehensive and focused holistically on the health outcomes of the babies.